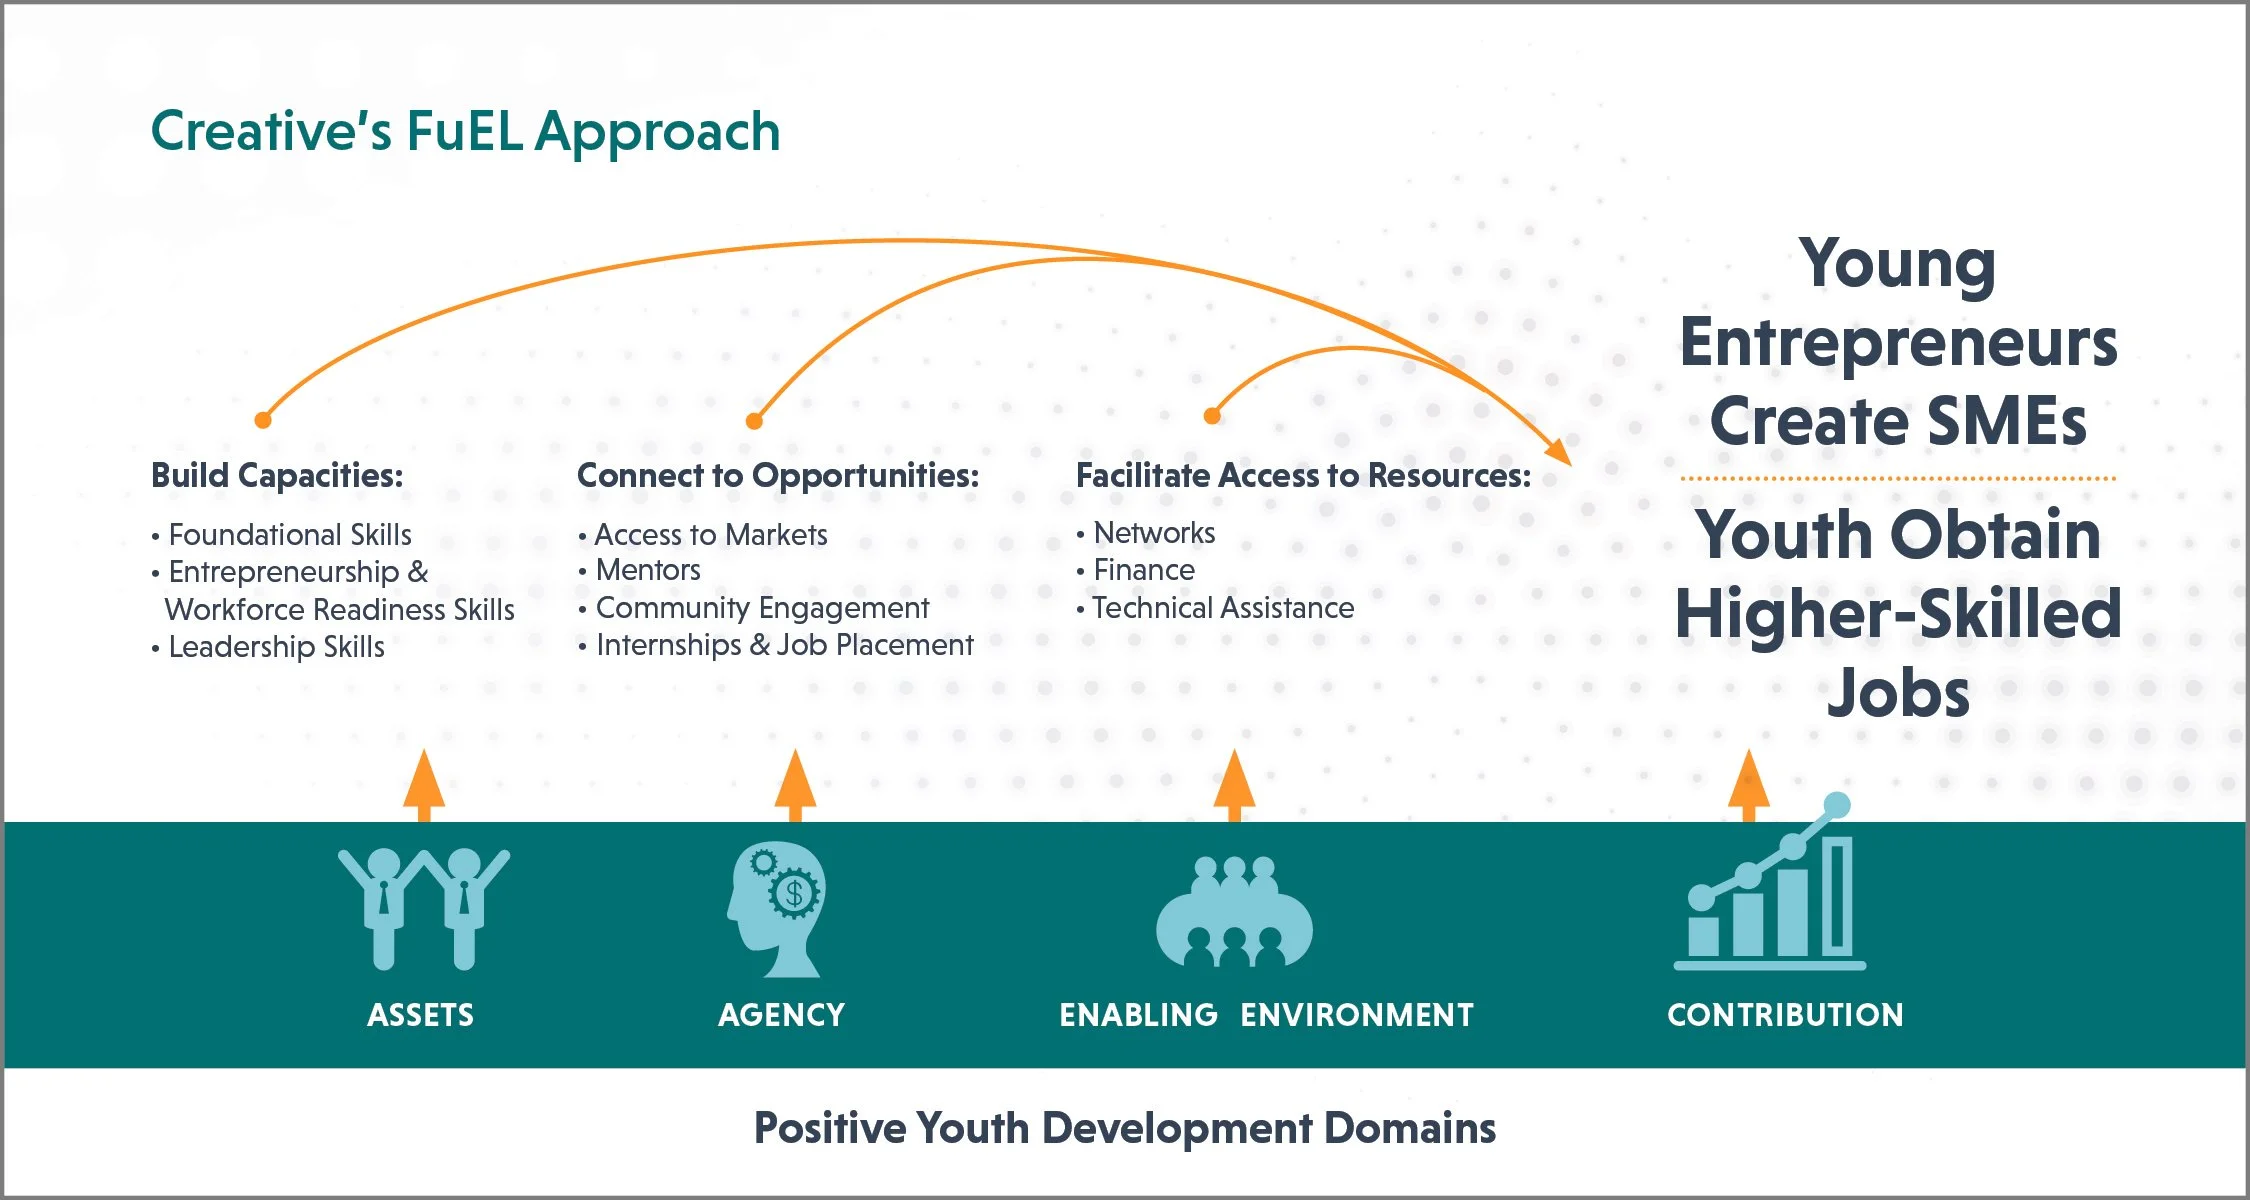
Infographics
Analytical Reasoning | Contextual Storytelling
Challenges & Approach:
The most consistent challenge is helping content owners clarify their message and think visually. Raw data alone doesn’t always tell a story—so I ask targeted questions to uncover what matters most to the audience. I then choose the right visual format and simplify where needed.
Outcome & Impact:
Well-designed data visualizations have improved the accessibility of technical content and helped organizations more effectively advocate for their mission. Stakeholders often report that infographics and charts enhance engagement with otherwise dense material, and internal teams appreciate the collaborative, thoughtful process I bring to every piece.
Overview:
I design custom data visualizations that transform complex information into clear, compelling visuals. These include infographics, charts, graphs, diagrams and maps tailored for reports, websites, presentations and social media. These graphics supports the communication of research findings, program results and policy impacts for a wide range of audiences.
My Role:
As both designer and strategic partner, I guide the process from raw data to finished visual. This often involves working directly with researchers, analysts or technical specialists to interpret their information and recommend the most effective visual format.


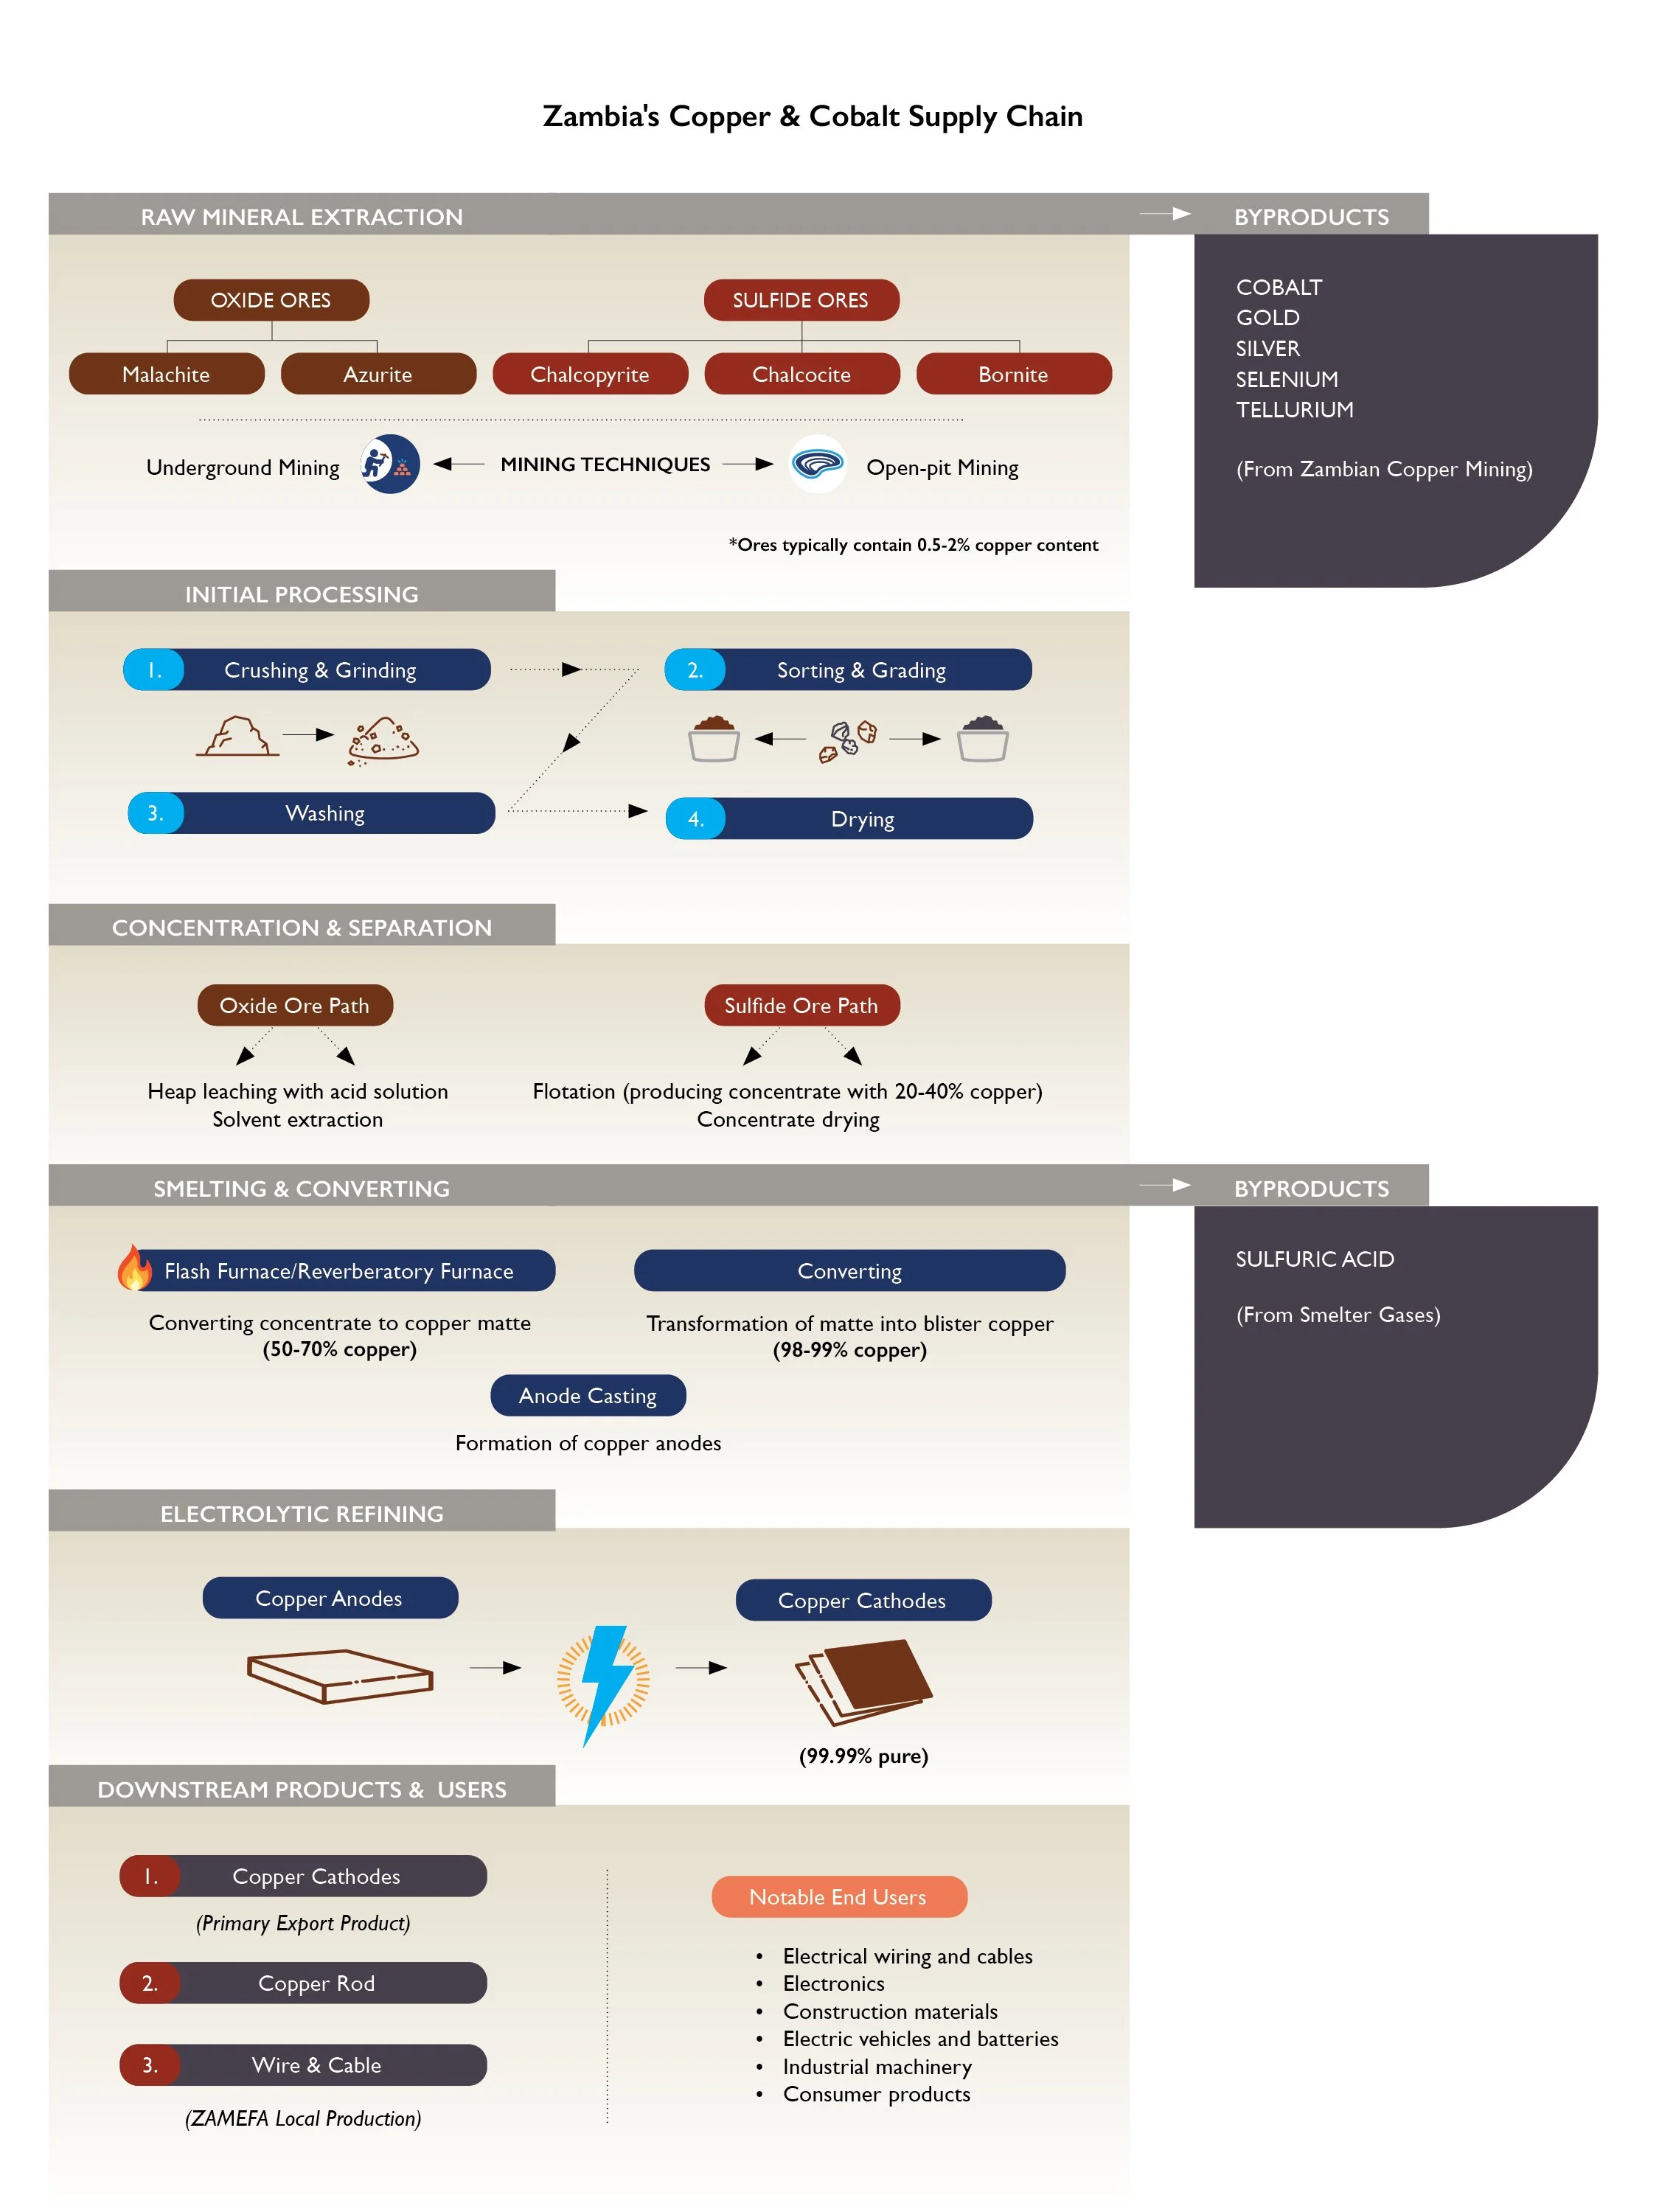


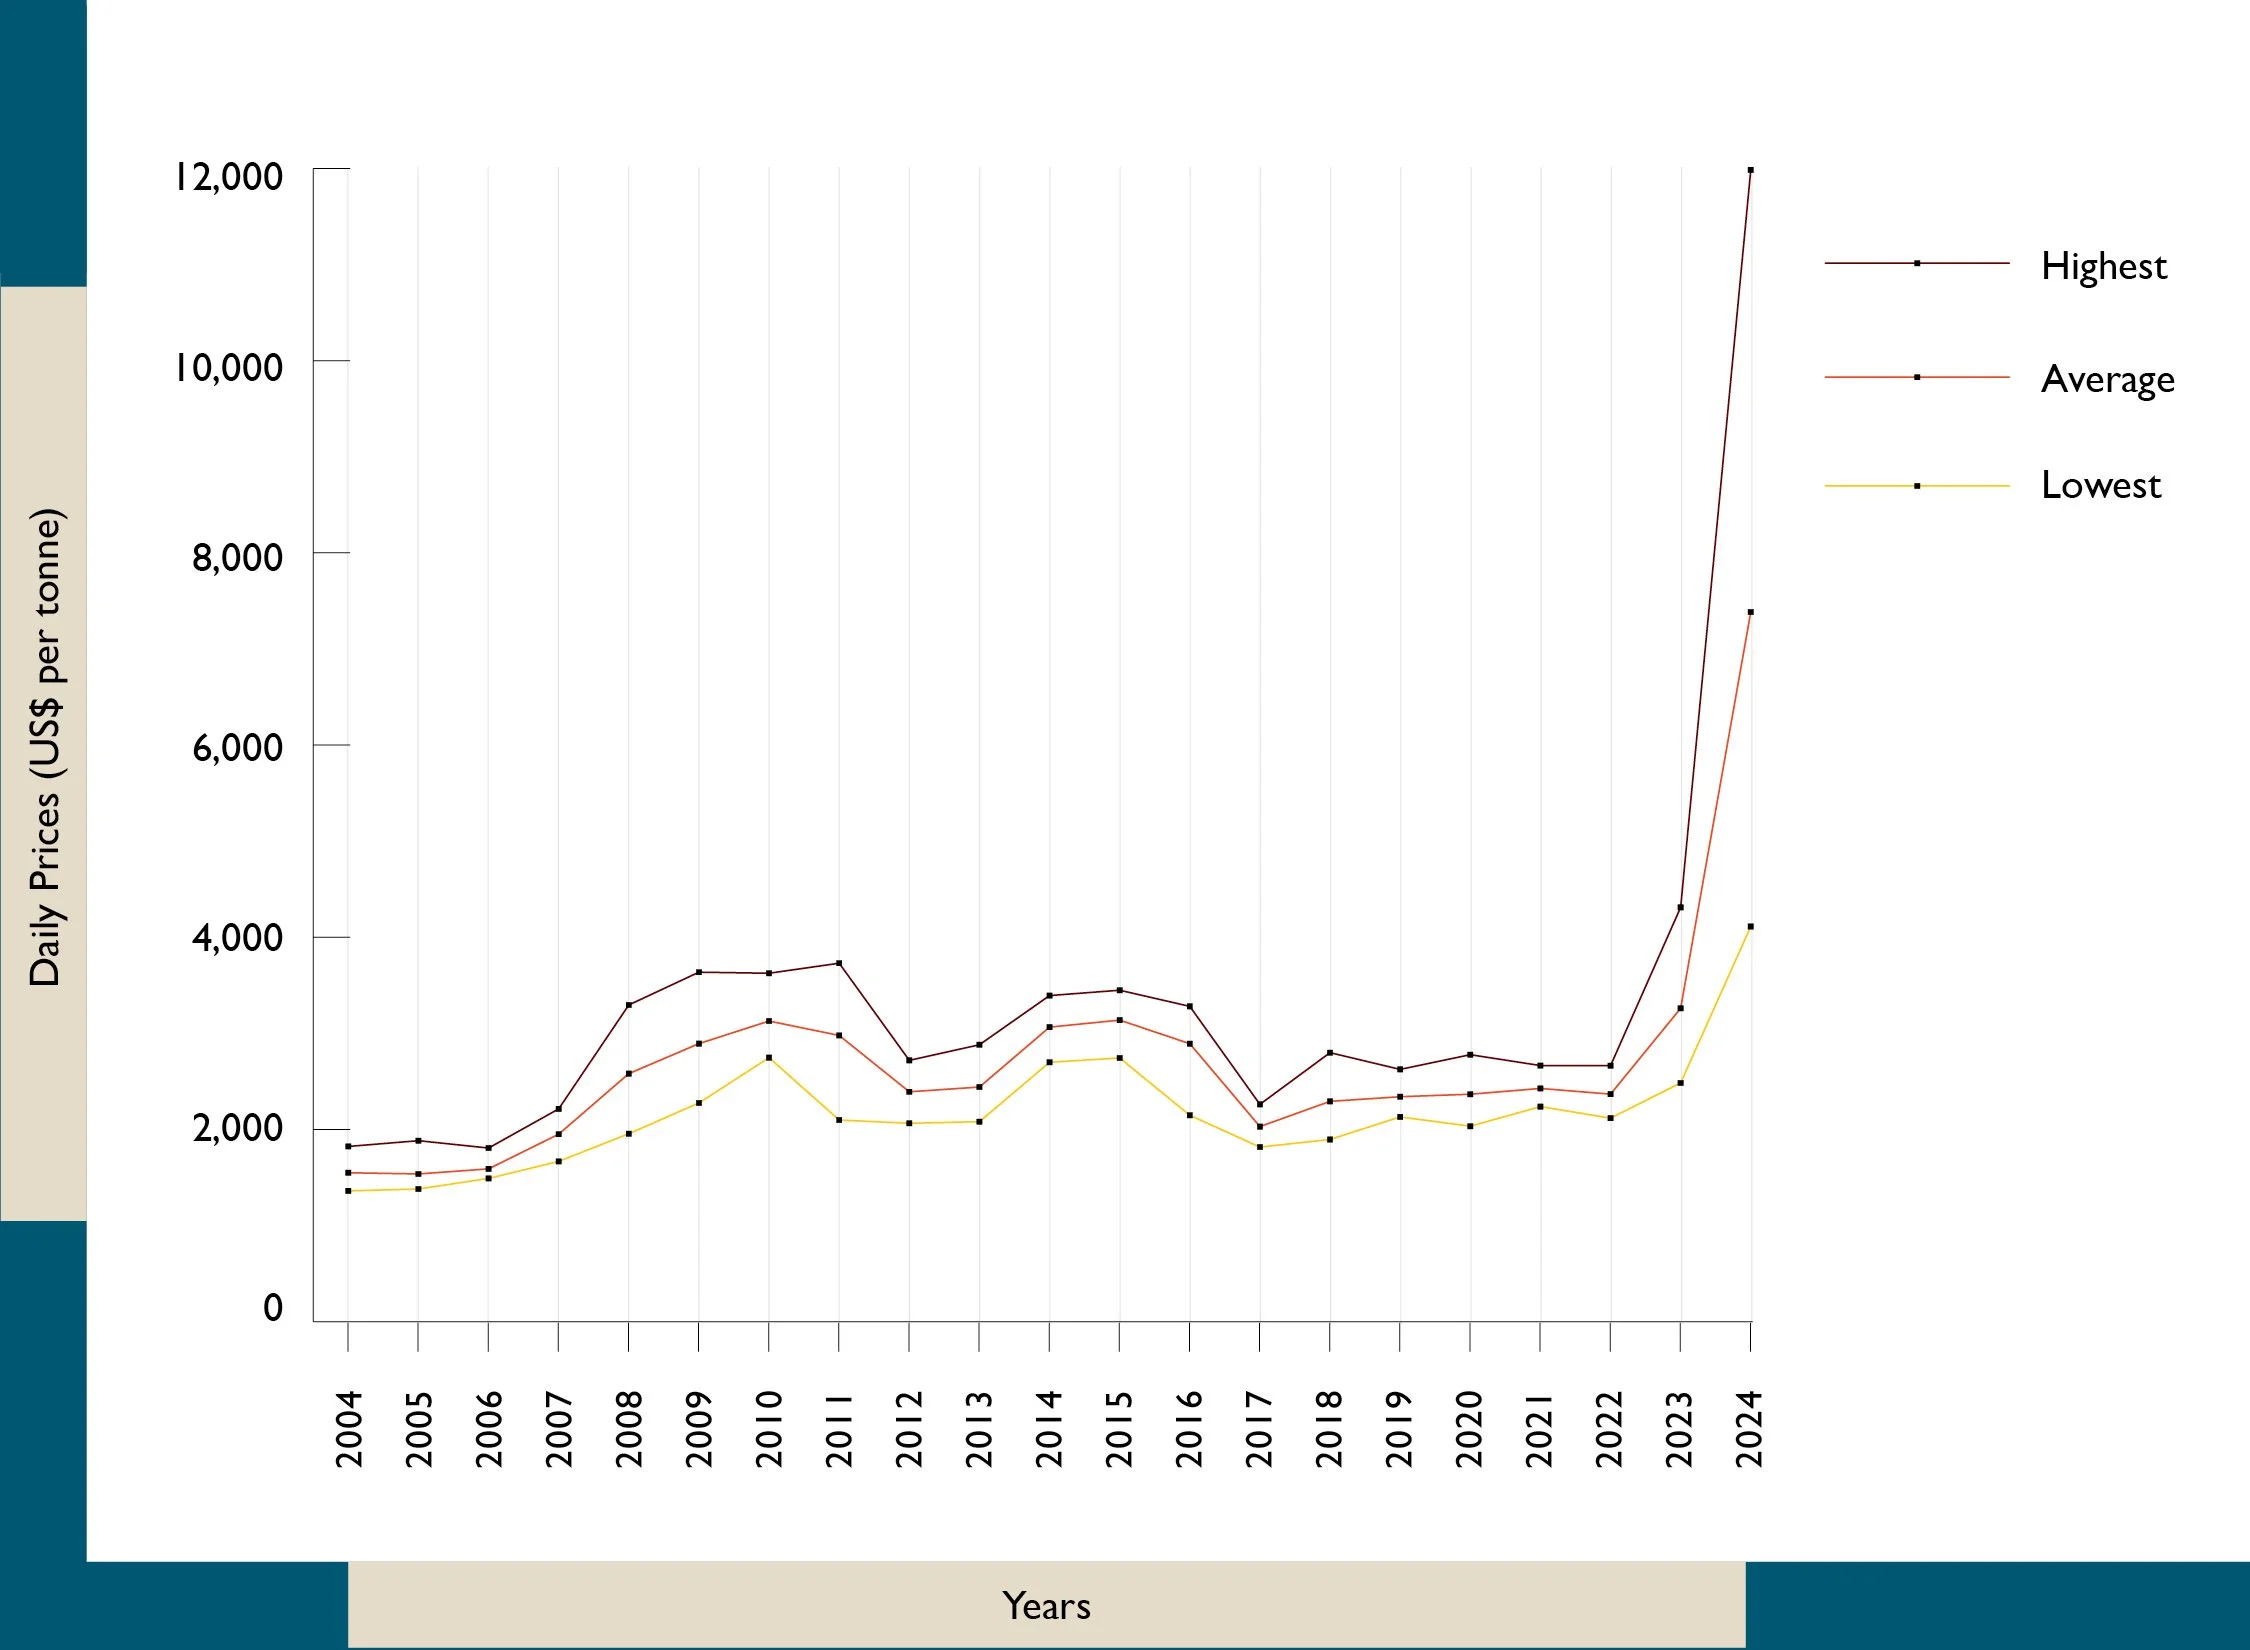
Formatted report charts


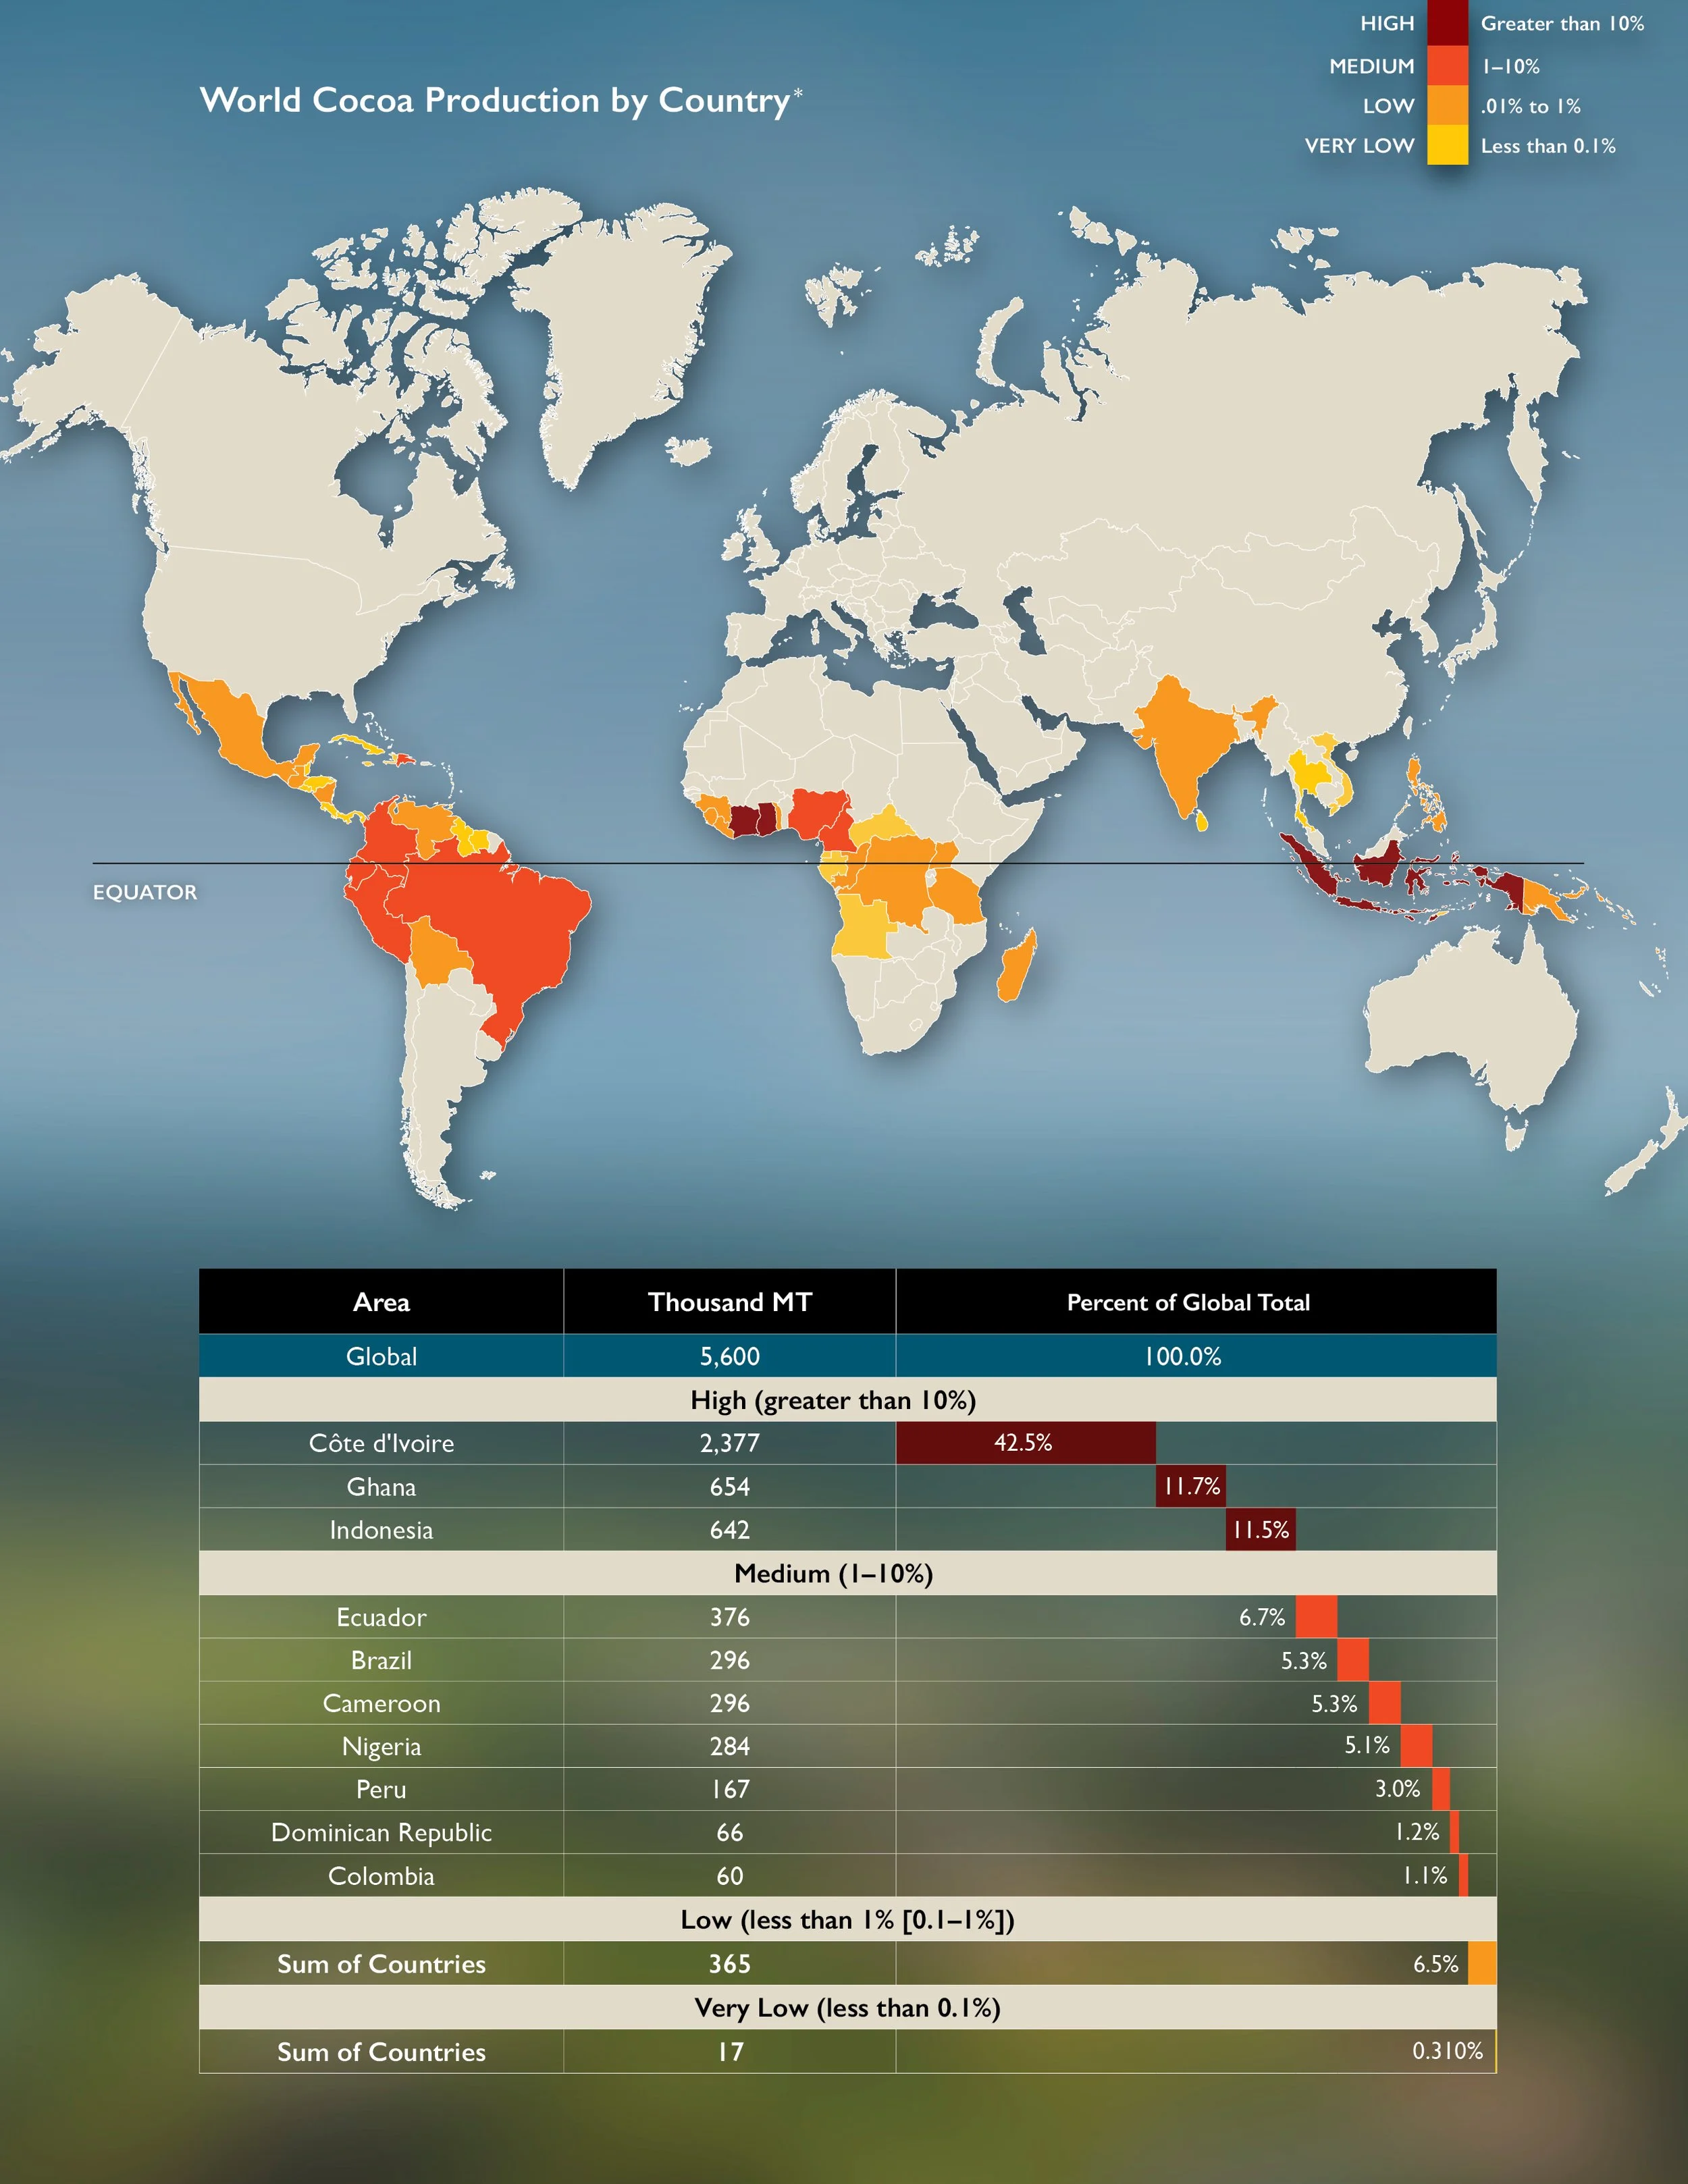
Economic development program statistics